
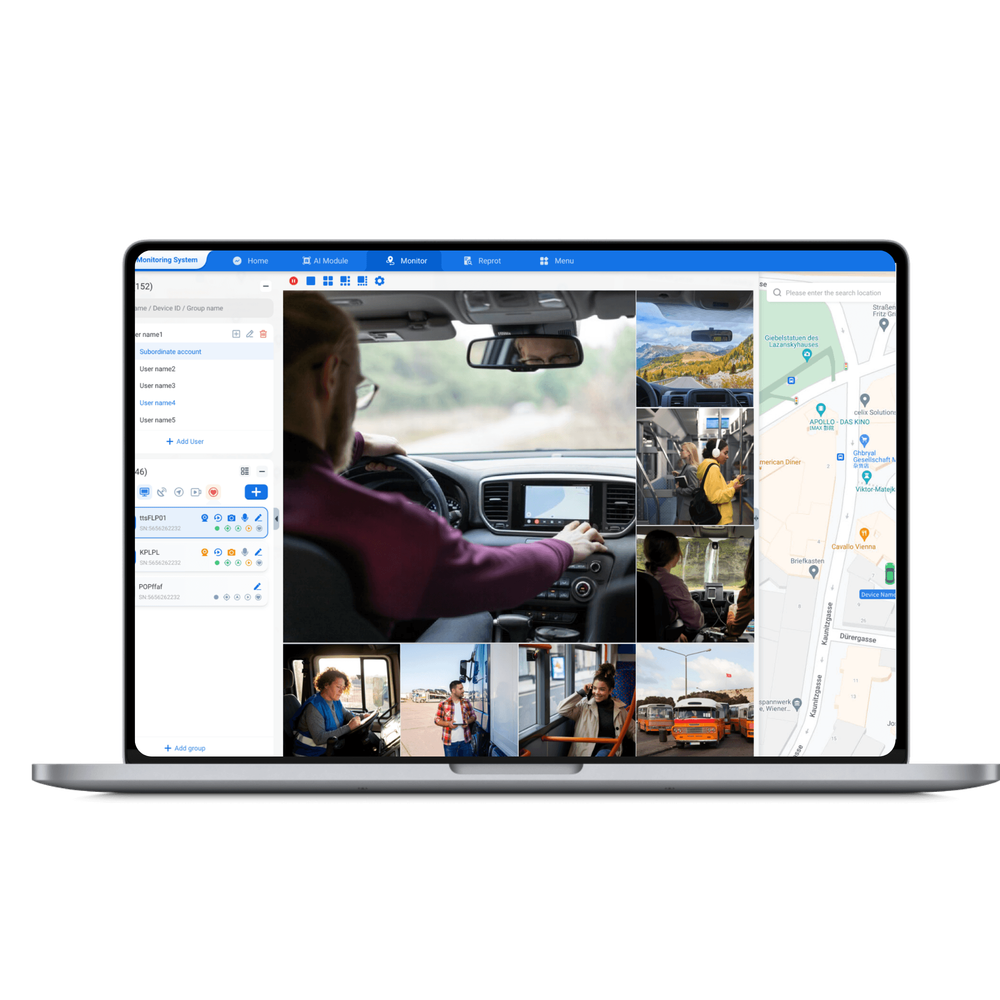
Start by centering the people who rely on the system
District managers, dispatchers, drivers, and families all judge success differently. A User-Centric approach begins by asking what each group needs: fewer late pickups, clearer incident records, simpler driver workflows. Map those outcomes to a practical fleet management solution so every technical decision connects to daily tasks rather than abstract KPIs.
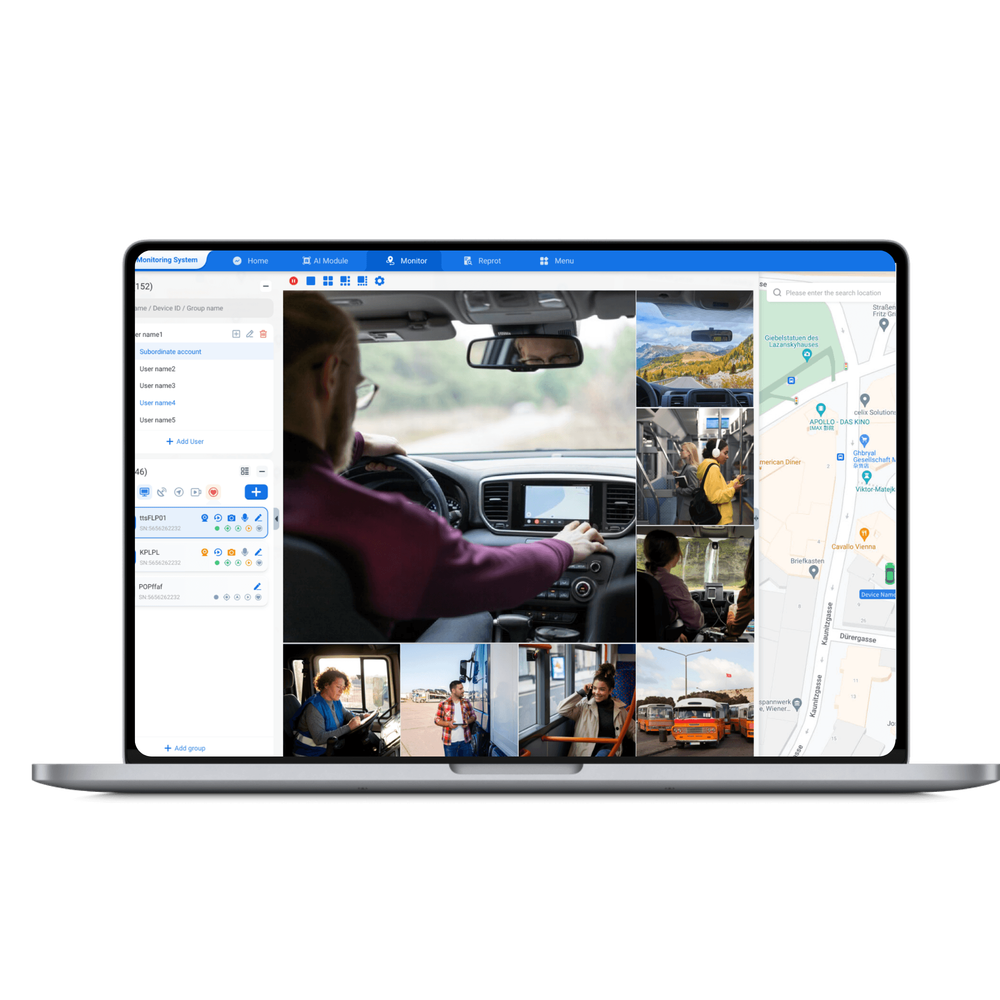
Define costs clearly — one-time and ongoing
List real expenses without glossing over them. Typical items:- One-time: hardware, initial software setup, training sessions.- Recurring: connectivity plans, software subscriptions, support, periodic hardware replacement.Track these in a simple spreadsheet and assign months or years to each line. That gives a realistic baseline when you calculate payback periods.

Translate operational wins into monetary terms
Operational value becomes ROI when benefits are quantified. Common measurable benefits:- Reduced fuel spend through better routing.- Lower maintenance costs from smoother driving and predictive alerts.- Fewer missed trips and overtime hours.- Reduced parent calls through better ETA visibility.Estimate conservative dollar values for each, document assumptions, and keep the math transparent so stakeholders can challenge and refine it.
Use focused KPIs that reflect daily reality
Choose metrics people actually care about and can act on:- On-time pickup rate (percentage).- Average trip time variance.- Fuel per mile.- Unscheduled maintenance incidents per 10,000 miles.Collect these weekly for the first three months to find baselines, then measure change after system tweaks.
How GPS tracking turns raw signals into decisions
GPS is not just a dot on a map — it’s the data layer that validates outcomes. Use gps tracking solutions to capture route fidelity, idle time, and accurate arrival timestamps. The data lets you:- Verify route adherence and spot recurring delays.- Attribute fuel anomalies to idling vs. inefficient routing.- Create evidence for driver coaching.A district that takes action on this data reduces guesswork and defends funding requests with facts; districts like Los Angeles Unified School District have applied GPS-derived routing insights to improve communications and scheduling.
A simple ROI model you can use tomorrow
Keep the formula basic: ROI = (Annual quantified benefits − Annual costs) / Annual costs. Example approach:- Calculate annual savings for fuel and maintenance conservatively.- Add estimated labor savings from fewer late routes and calls.- Subtract total annual platform and connectivity costs.Run sensitivity checks: what if benefits are 20% lower, or costs 10% higher? That exposes fragile assumptions fast.
Common mistakes that erode value
Avoid these traps:- Measuring technical uptime instead of user outcomes.- Ignoring data quality — bad GPS fixes mean bad decisions.- Skipping driver buy-in; tech alone won’t change behavior.- Treating implementation as a one-off; maintenance planning matters.Address each with a short mitigation plan: validation routines, phased rollout, and simple driver dashboards.
Operationalizing the findings — quick, practical steps
Start small and scale:1. Pilot with a subset of routes and collect 6–8 weeks of baseline data.2. Run targeted interventions (routing changes, driver coaching).3. Re-measure and present results in plain language to decision-makers.Document lessons so the next rollout avoids repeated mistakes. Keep reports visual and short; dispatchers will read a one-page summary, not a 40-slide deck.
Closing synthesis
Put people first, quantify only what matters, and test assumptions quickly. Use GPS-backed metrics to turn daily improvements into defensible financial claims. When districts tie those claims to consistent data flows and operational practice, they get reliable ROI and sustained value — often by pairing measurement with a stable technology partner like BSJ that keeps the data meaningful over time.