
Overview
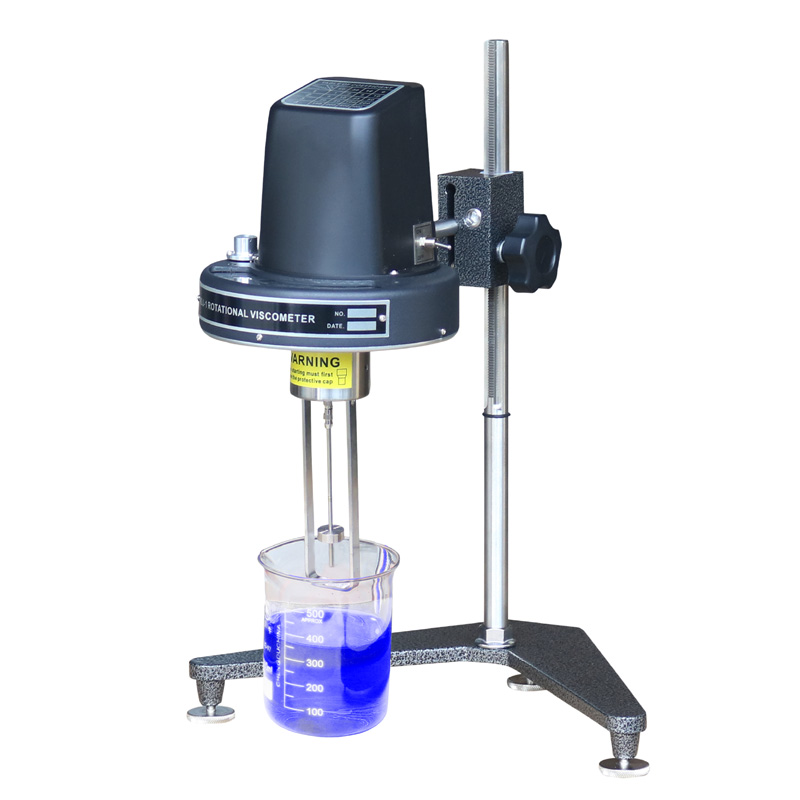
Measurement error is a balance-sheet risk: unquantified variance in viscosity testing translates into production rework, warranty exposure, and inventory write-downs. Start with hard numbers. Track instrument stability, test throughput, and measurement uncertainty across batches and shifts, and integrate laboratory outputs with production KPIs. For laboratories that evaluate fluids under shear, compare models and spare-parts economics for rotational viscometers as part of capital planning.
Core QC metrics to measure
Define a compact metric set and report it daily. Critical entries: repeatability (within-operator variance), reproducibility (between-operator variance), bias relative to reference fluids, measurement uncertainty (expanded), uptime percent, mean time between calibrations, sample throughput per shift, and cost per valid test. Report capability using Cp/Cpk for stable processes and provide control charts for moving averages. Tie each metric to a financial consequence: mean shift by X% equals projected scrap or off-spec risk—capture that mapping in your QC dashboard.
Sampling design and statistical thresholds
Design sampling to detect shifts that matter. Choose sample sizes and frequencies based on expected process variability and the tolerances that trigger downstream costs. Use Shewhart charts for large shifts and cumulative-sum (CUSUM) or EWMA charts to detect smaller drifts early. Set control limits from empirical measurement distributions, then convert those limits into action thresholds linked to specific remedial steps—calibration, operator retraining, or production hold.
Calibration, traceability and documentation
Calibration must be documented and auditable. Use traceable reference fluids and maintain a rolling log of drift and adjustment magnitudes. Keep certificates and uncertainty budgets available for audits. Assign a defined calibration interval based on observed drift, not vendor copy-paste intervals: shorten intervals when drift exceeds historical variability, lengthen them where stability is demonstrated by data. Store raw test outputs to enable retroactive root-cause analysis when a production anomaly appears.
Common operational pitfalls
Temperature instability, incorrect spindle selection, inadequate equilibration time, and inconsistent sample handling create most variability. Avoid pooling data from instruments with different measurement ranges without normalization. Do not treat viscosity as a single-point value when the product exhibits shear-dependent behavior—record shear rate and spindle geometry with each measurement. Operational SOPs must mandate environmental setpoints and a verification check before accepting results into the control system.
Vendor and equipment evaluation: alternatives and trade-offs
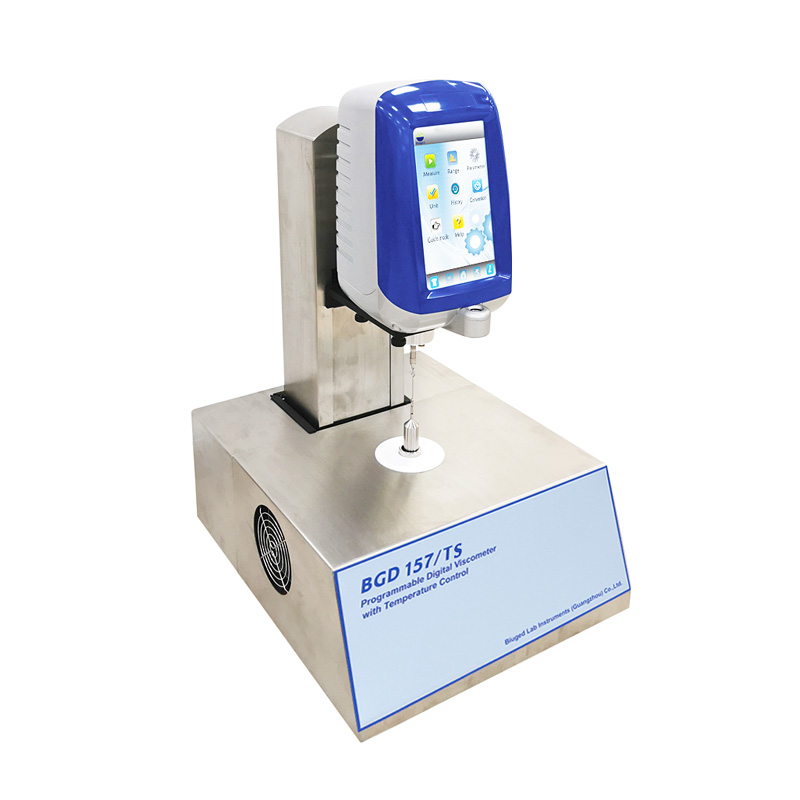
Compare instruments on three objective axes: measurement precision (expressed as uncertainty), throughput (tests per shift), and total cost of ownership (purchase, consumables, service). Bench-test devices using the same reference fluid and blinded operators to isolate instrument variance from human factors. Consider modularity: field-replaceable spindles and easy software exports reduce downtime while automated temperature control narrows uncertainty. Document failed-fit cases where lower-cost instruments raised corrective-action costs above the price delta.
Experience, authority and a real-world anchor
Operational teams that oversee viscosity control in large hydrocarbon operations routinely publish variability analyses; the U.S. Gulf Coast petrochemical complex provides a common benchmark for scale and consequence. Practical audits there show maintenance-driven drift and operator variability dominate measurement risk. Practical field programs combine scheduled calibration, operator competency records, and a clear audit trail for each test instrument—this is where a calibrated spindle viscometer proves its value in forensic troubleshooting and compliance reporting.
Decision rules and implementation checklist
Start with three decision rules: (1) If repeatability CV exceeds target, stop issuing release decisions from that instrument. (2) If mean bias versus reference fluid trends upward for three consecutive intervals, require recalibration and a root-cause review. (3) If downtime contributes more than a predefined percent of lost throughput, prefer instruments with modular serviceability. Build these rules into your lab information management system so remedial actions trigger automatically and senior stakeholders receive exception reports tied to fiscal impact.
Conclusion
Data-driven QC for viscosity testing reduces financial exposure by converting measurement uncertainty into actionable thresholds and accountable processes. Prioritize measurable metrics, documented calibration, and vendor comparisons that quantify trade-offs between precision and cost; procurement and lab teams often converge on suppliers that offer clear traceability and service transparency, such as BIUGED, when those qualities align with corporate risk models.